These days it seems that every institution is losing grant money. Nonetheless, some institutions are becoming increasingly competitive as they secure ever-larger percentages of the R01 grant pool over time. For the 50 institutions with the largest fraction of the active R01 grants in 2013, identified in our previous blog post, we calculated how this fraction has changed over every year from 1985 to 2013. Indeed, there are many institutions that are holding steady, such as Johns Hopkins University and Stanford University, which have held a nearly constant 2.4% and 1.4% of the grant pool over the last 27 years, respectively.
And as there is in any dynamic population, some institutions are expanding in that fraction, but at the expense of others. For example, Massachusetts General Hospital has expanded 2.5-fold from 0.6% in 1985 to 1.5% in 2013. On the other hand, Tufts University has continuously declined, dropping 2-fold from 0.87% in 1985 to 0.45% in 2013.
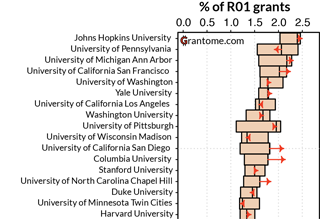
The complete results of the analysis for all 50 institutions are summarized below. Each histogram bar represents the range in the percentage of grants that has been held between 1986 and 2013. The current, 2013 level is represented by a black vertical line. Finally, arrows inform on the latest trend in how these values are changing, where their length and direction reflect predictions in the level of funding that each institution will have over the next 3 years. These predictions were made from linear extrapolation of the average rate of change that was observed over the last 3 years.

From the direction of the arrows, half of the schools is increasing and the other half is decreasing. Perhaps this is not surprising. However, the institutions with the highest rates of change, where the arrows have the longest lengths, are all on the rise! These institutions are University of Michigan Ann Arbor, University of California San Diego, Massachusetts General Hospital, New York University, and University of California Davis. It would be interesting to know what institutional policies have resulted in their success at winning ever larger pieces of the R01 grant pool.
How is your institution performing? If it’s not in the plot, find out by using our search engine, where you can refine your search by institution and grant type!