Recent data reported by the NIH suggests that the number of PIs that are funded by R01 and R01-equivalent grants has been nearly constant for many years. Yet from the perspective of a PI who is down in the trenches fighting for funding, people seem to be losing their grants left and right, with well-established and historically successful investigators sending in multiple grant applications at every opportunity. How many of these PIs are fighting for any funding, for the survival of their lab?
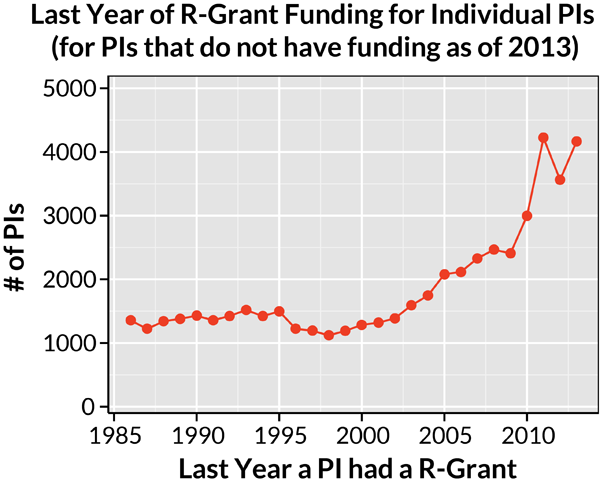
We decided to analyze the number of PIs who had R01-equivalent grant funding and lost it, that as of 2013 failed to obtain a new NIH grant. For each PI we calculated the number of R01-equivalent grants he/she had per year, considering R00, R01, R21, R23, R29, R37 and R56 grants (the reasoning for this can be found on one of our previous blog entry). For each year we tallied the number of PIs that lost having any form of NIH funding. The results are shown on the plot below.
The number of PIs "exiting the system" per year was nearly constant between 1985 and 2002 at ~1,400 per year. Yet over the last decade the numbers have tripled, peaking at ~4,200 in 2010 and 2012. In this analysis we cannot distinguish between PIs who are retiring at the end of their career, and those that have undesirably lost their NIH support. Yet these numbers are in stark contrast to the report that the number of NIH-funded PIs has been nearly constant over this same time period. If the NIH were supporting a stable pool of PIs, then it would be expected that the yearly flux would not only be constant in value, but also a small fraction of the total pool (4,200 out of 20,000 PIs with funding is close to 20%!).
To put the last few years in perspective, over 50% of PIs lost their funding and did not renew it by 2013.

For PIs that had an active R-grant in 2013, we also calculated the number of years that each PI had continuous funding prior to 2013. The results are shown above as a survival function, where the X-axis is the number of years of prior R-grant funding, and the Y-axis represents the number of PIs that had funding for AT LEAST that number of years. Out of the ~20,000 PIs that had a R-grant in 2013, 744 have had stable, continuous funding since 1985. One quarter of all currently funded PIs have had stable funding for 10 years or more. In contrast, half of PIs (~10,000) had stable funding ONLY for the 5 year duration of a single R01 grant. Some of these PIs may be initially entering the pool of funded PIs, while others may have been in the system but lost continuity in funding for at least 1 year. Further analysis (not shown) indicates that ~7,500 of these PIs fall in the latter category. Thus, there are as many PIs with long term, stable funding as those who have trouble maintaining it.
Although the size of the NIH-funded pool of PIs has been stable over the last decade, the analysis of the dynamics of this pool suggests a grimmer reality. Rather, there is a dynamic instability, with large numbers of PIs flowing into and out of it every year.
Which category are you in?